Performance tuning using Visual Studio 2010
In this post I’ll be showing you how to use Visual Studio 2010 performance analysis tools to find slow parts in your code, make changes and then verify that those fixes have actually been beneficial.
I will be analyzing the LIFTI code as of change set 54973, so if you want to you can download it and follow along, although the general principles will be the same regardless of project.
What are we analyzing?
LIFTI is just a framework assembly; it doesn’t have any associated executable, other than sample code. To give me some runnable code to test, I’ve modified the Lifti.Comparison project to accept a command line argument; when that argument is received, only a subset of the code is executed:
- Create a full text index with a stemming word splitter
- Populate the index
- Search for various words a number of times
Getting started
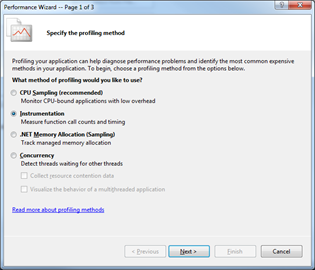
Select Analyze/Launch Performance Wizard… from the menu:
Because the code we are testing is already quite targeted, I’ve chosen to select Instrumentation. This will give us a very fine level of detail, as most methods will be instrumented. (Small methods, such as property accessors are excluded by default.)
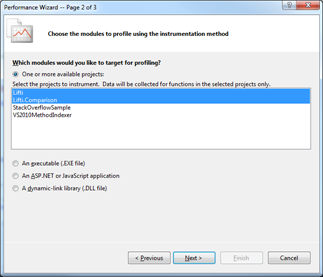
After pressing Next you get to select the instrumentation targets:
We’re only really interested in targeting the main LIFTI assembly, but by selecting the comparison executable for profiling life is made a little easier later on, as the profiler has an executable to launch.
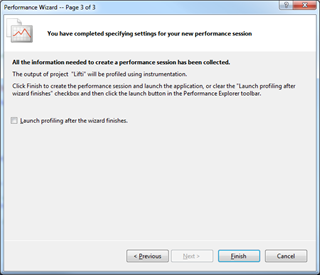
Before clicking Finish on the last page of the wizard, we just need to uncheck the “Launch profiling…” checkbox - there are a couple of tweaks we need to make before we get going.
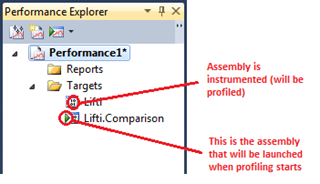
After clicking Finish, your new performance session should appear in the Performance Explorer panel, looking something like this:
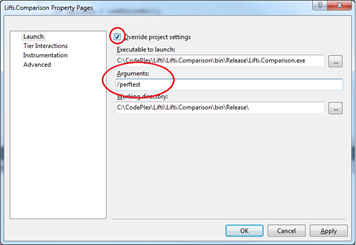
Right click on the Lifti.Comparison target and select properties:
We need to instruct the comparison executable to only perform the performance test code - we do this by passing in the /perftest switch.
We’re not interested in profiling the test harness itself, so we need to make sure that it’s not being instrumented. Right-click on the Lifti.Comparison project again, this time unchecking the Instrument option. (Note that the binary 1’s and 0’s disappear from the icon)
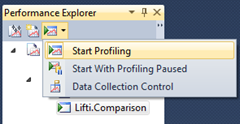
Ok, we’re ready to get some baseline performance data. Select Start Profiling from the Start Profiling menu. (You can just click on the button, but it’s good to know there are other options here!)
BOOM! What’s does that warning mean?
One thing I didn’t mention yet is that LIFTI is a signed DLL. This means that profiling will not work out of the box - you’ll get this warning:
Lifti.dll is signed and instrumenting it will invalidate its signature. If you proceed without a post-instrument event to re-sign the binary it may not load correctly. Would you like to continue without re-signing?
If you try to continue regardless things are not going to work. There are 2 things we can do to fix this:
- Write a post-instrumentation event to re-sign the binary (as the warning suggests).
- Get the Visual Studio team to make the process easier, like they have done with unit test code coverage.
- Don’t sign the assembly in the first place.
For simplicity we’ll go with option 3. In the LIFTI project properties, signing tab, uncheck Sign this assembly.
Select Start Profiling again and we can start to see some results.
The Summary report
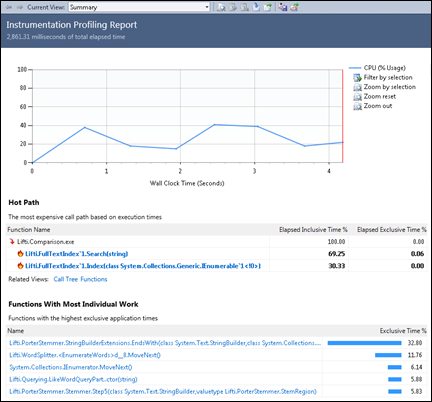
After the application exits, you’ll eventually see a report not dissimilar to this:
From top to bottom, this shows:
- The number of milliseconds it took to execute the code (2861.31, or just under 3 seconds in this case)
- A graph of CPU utilization throughout the lifetime of the analysis
- The “hot path”; also known as “functions you should really pay attention to”
- Functions with the most individual work. These are the functions actually responsible for consuming execution time, i.e. the code is executing directly in their function body, not in functions that they call into.
It’s not really surprising that the Search and Index methods are our hot paths here - they are the methods being called multiple times from the test harness. The EndsWith method, however, seems to be executing for nearly 1/3 of the time the application is being profiled, and that really is interesting.
Clicking on any of the methods on the screen brings up the Function Details report.
Function Detail reports
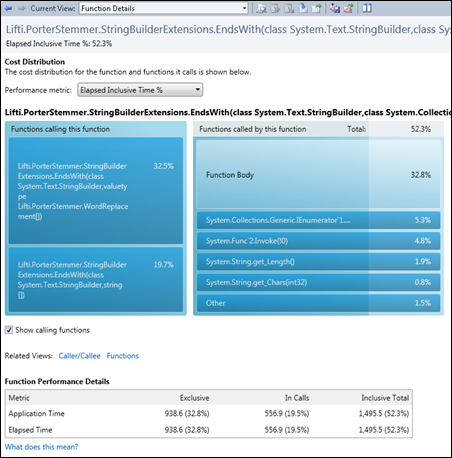
The report above is for the StringBuilderExtensions.EndsWith function. Looking at the blue blocks in the top half of the report, you can see:
- On the left, the calling functions - the function being reported on is actually the private implementation of two separate public functions - these are both visible here.
- On the right, the functions that are called from this function, including framework methods.
You can click on any of these boxes to navigate to the associated function.
At the bottom of the report we can see confirmation of the amount of overall time the function was responsible for. Exclusive time is the time spend within the function’s body, Inclusive time is the amount of time spent either in the function’s body plus the amount of time in calls to other functions. Judging by this, EndsWith is actually responsible for over 50% of the overall application’s time when you take into account time in calls.
So we should just rewrite this function, right? Before we throw the baby out with the bathwater, we should probably have a look at it.
 1
 2public static string EndsWith(
 3    this StringBuilder builder,
 4    params string[] substrings)
 5{
 6    return EndsWith(builder, substrings, s => s);
 7}
 8
 9public static WordReplacement EndsWith(
10    this StringBuilder builder,
11    params WordReplacement[] potentialReplacements)
12{
13    return EndsWith(builder, potentialReplacements, p => p.MatchWord);
14}
15
16private static TMatch EndsWith<TMatch>(
17    this StringBuilder builder,
18    IEnumerable<TMatch> potentialMatches,
19    Func<TMatch, string> matchText)
20{
21    var length = builder.Length;
22    foreach (var potentialMatch in potentialMatches)
23    {
24        var test = matchText(potentialMatch);
25        if (length < test.Length)
26        {
27            continue;
28        }
29
30        var matched = true;
31        for (int i = length - test.Length, j = 0; i < length; i++, j++)
32        {
33            if (builder[i] != test[j])
34            {
35                matched = false;
36                break;
37            }
38        }
39
40        if (matched)
41        {
42            return potentialMatch;
43        }
44    }
45
46    return default(TMatch);
47}
There isn’t anything drastically wrong with this code - maybe we could think about removing the need for the delegate parameter and duplicating the code in each of the public functions, but that probably won’t make a huge difference. I might try this later anyway just purely out of interest, but I’ll leave it for now; I have a feeling there may be bigger gains to be made.
Let’s get a bit more detail about how the function is being used. To do this we can click on the Related Views' Functions link to take us to the Functions report.
The Functions report
This report lists the functions called by your code. You can sort it by whatever metric you’re interested in, and it can present a substantial amount of information - you can add and remove a plethora of columns.
The test harness performs 7000 individual searches, so with over 72000 calls to EndsWith, that’s over 10 calls to this method for each search. As we’ve seen, EndsWith takes a list of potential matches to search for, looping through them one at a time. This may go some way to explain why it’s taking up so much time.
So if there are no big gains to make optimizing the function itself, maybe we can reduce the number of times it’s being called, or at least reduce the number of matches to search for?
Making some improvements
The EndsWith function is part of the Porter stemming algorithm implemented in LIFTI. One of the things that this algorithm does a lot is check to see if a word has a certain ending, and either remove or replace it. (Hence the implementation of EndsWith.) At the moment the Stemmer class has a whole load of arrays that define the replacements that can occur at various stages, e.g.:
 1
 2private readonly WordReplacement[] step1bReplacements =
 3{
 4    new WordReplacement("eedly", "ee"),
 5    new WordReplacement("ingly", String.Empty),
 6    new WordReplacement("edly", String.Empty),
 7    new WordReplacement("eed", "ee"),
 8    new WordReplacement("ing", String.Empty),
 9    new WordReplacement("ed", String.Empty)
10};
One of the things I noticed was that in general the search words (the first parameter to the WordReplacement constructor) ended in a relatively small set of characters. In the example above only y, d and g.
What I decided to do was change the EndsWith method that takes the array of WordReplacements to this:
 1
 2public static WordReplacement EndsWith(this StringBuilder builder,
 3    Dictionary<char, WordReplacement[]> replacementSetLookup)
 4{
 5    WordReplacement[] potentialReplacements;
 6    if (builder.Length > 0 &&
 7        replacementSetLookup.TryGetValue(builder[builder.Length - 1],
 8            out potentialReplacements))
 9    {
10        return EndsWith(builder, potentialReplacements, p => p.MatchWord);
11    }
12
13    return default(WordReplacement);
14}
So instead of just blindly looping through all the potential replacements, we use the last character in the word to look up the only the replacements that might be relevant. Obviously we have to change how the replacements are stored in the Stemmer class:
 1
 2private readonly Dictionary<char, WordReplacement[]> step1bReplacements =
 3    CreateReplacementLookup(new[] {
 4        new WordReplacement("eedly", "ee"),
 5    ...
 6        new WordReplacement("ed", String.Empty)
 7    });
 8
 9private static Dictionary<char, WordReplacement[]> CreateReplacementLookup(
10    IEnumerable<WordReplacement> replacements)
11{
12    return (from r in replacements
13            group r by r.MatchWord[r.MatchWord.Length - 1]
14            into g
15            select g).ToDictionary(r => r.Key, r => r.ToArray());
16}
Let’s have a look at what, if any, impact this makes.
Spot the difference
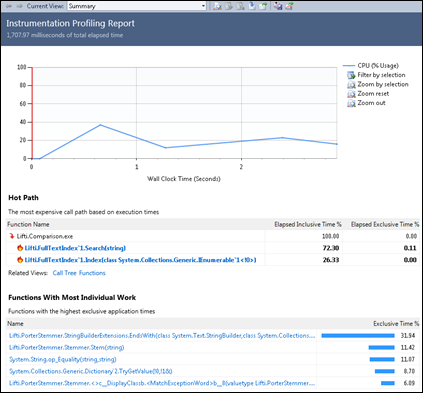
Running the analysis again, we get a new Summary report:
Immediately we can see that the total elapsed time has gone down to 1707.74ms - that’s over 1000ms (40%) faster - not to be sniffed at for such a small change.
Wrap up (for now)
There are probably many more improvements that could be made to the code, but I hope that’s given a brief overview of how you might go about analysing and improving your own code, but please, always remember:
- Measure before and after making changes - getting these metrics will not only give you a warm fuzzy feeling when you’re going the right way, but they’ll also protect you from taking the performance in the wrong direction.
- As much as possible, try to have the code that you’re changing covered by unit tests - sometimes optimizations can lead to subtle behavioural changes that don’t immediately reveal themselves.
There’s so much more I could go into with the performance analysis, both with the reports I’ve already shown and others, but I’ll leave it there for now. Drop me a comment if this is something you want to see more of.
