Debugging "The agent process was stopped while the test was running"
I’ve encountered the unhelpful “The agent process was stopped while the test was running” MSTest error result a couple of times recently, and I thought that I’d share a few of my findings and approaches to debugging the unit tests that cause them.
The MSTest “Error” Result
In my experience, the Error result usually manifests itself for one of a two reasons:
- A critical error occurred during the execution of the test. This might be due to something caused by the code executed by the test, for example a stack overflow error, but it may also occur when the test framework is unable to execute the test for some reason, e.g. it is unable to copy dependent files.
- A test caused some code to be executed on another thread, and ** an exception occurred on that thread, not the main test one.
The first of these is easy to overcome, as I’ll show later, however the second can, under some circumstances, be much trickier to diagnose.
Viewing the Test run error information
The error results are usually presented in the Test Results window like this:
Side note: you can see that I’ve grouped the tests by their result - this is my preferred approach to viewing my unit tests in this window.
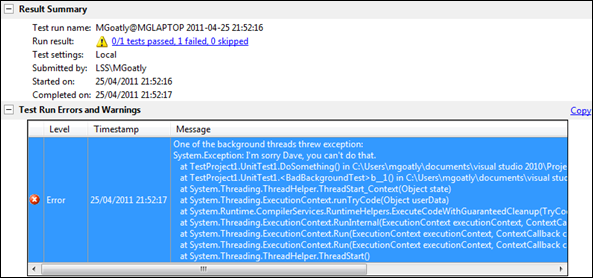
When the test results contain an error, you can get more details by clicking on the “Test run error” hyperlink. This shows you the error details for each of the tests that ended up with the Error result, and may well provide you with enough information to solve your problem:
Here you can see that an error on the background thread caused the test to fail. If you’re lucky, this window should given you enough information to fix your problem.
Background threads
Something that’s important to consider is that if your code makes use of background threads that live on beyond the lifetime of the test, an exception raised on this thread can cause the error to be reported against a subsequent test!
Take these sample tests:
 1
 2[TestMethod]
 3public void BadBackgroundTestCausingDelayedError()
 4{
 5    // Create another thread and execute it - this test will pass,
 6    // but the exception raised by the thread will cause ANOTHER test to fail.
 7    var thread = new Thread(() =>
 8        {
 9            DoSomething();
10        });
11
12    thread.Start();
13}
14
15[TestMethod]
16public void GoodTest1()
17{
18    // Pretend to do some work
19    Thread.Sleep(2000);
20}
21
22private void DoSomething()
23{
24    throw new Exception("I'm sorry Dave, you can't do that.");
25}
When executed in order, you’ll see this in the test results:
Uh, oh. The test that did nothing wrong was blamed for the failure of the bad one. Looking at the Test run error report will help a little in this case - the call stack looks like this:
 1
 2One of the background threads threw exception:
 3System.Exception: I'm sorry Dave, you can't do that.
 4   at TestProject1.UnitTest1.DoSomething() in UnitTest1.cs:line 56
 5   at TestProject1.UnitTest1.<BadBackgroundTestCausingDelayedError>b__0() in UnitTest1.cs:line 20
 6   at System.Threading.ThreadHelper.ThreadStart_Context(Object state)
 7   at System.Threading.ExecutionContext.runTryCode(Object userData)
 8   at System.Runtime.CompilerServices.RuntimeHelpers.ExecuteCodeWithGuaranteedCleanup(TryCode code, CleanupCode backoutCode, Object userData)
 9   at System.Threading.ExecutionContext.RunInternal(ExecutionContext executionContext, ContextCallback callback, Object state)
10   at System.Threading.ExecutionContext.Run(ExecutionContext executionContext, ContextCallback callback, Object state, Boolean ignoreSyncCtx)
11   at System.Threading.ExecutionContext.Run(ExecutionContext executionContext, ContextCallback callback, Object state)
12   at System.Threading.ThreadHelper.ThreadStart()
If you look carefully, you might see some indication of the test that the exception originated from.
No call stack in the results window
You can’t always infer the test at the root of the problem from this call stack. Indeed, there are times when you don’t get any stack trace information - like this:
When this happens, I’ve found that it’s usually because the exception that is being thrown from the other thread is a custom exception and the test framework is unable to de-serialize it into the test AppDomain. If you dig around in the debug output you might find exception details that indicate this:
 1
 2E, 1020, 17, 2011/04/25, 22:34:14.366, MGLAPTOP\QTAgent32.exe,
 3    Unhandled Exception Caught, reporting through Watson:
 4    System.Runtime.Serialization.SerializationException:
 5    Unable to find assembly 'TestProject1, Version=1.0.0.0, Culture=neutral, PublicKeyToken=null'.
 6   at System.Runtime.Serialization.Formatters.Binary.BinaryAssemblyInfo.GetAssembly()
 7   ...
 8   at System.Runtime.Remoting.Channels.CrossAppDomainSerializer.DeserializeObject(MemoryStream stm)
 9   at System.AppDomain.Deserialize(Byte[] blob)
10   at System.AppDomain.UnmarshalObject(Byte[] blob)
11The program '[1020] QTAgent32.exe: Program Trace' has exited with code 0 (0x0).
12The program '[1020] QTAgent32.exe: Managed (v4.0.30319)' has exited with code -2 (0xfffffffe).
Debugging the tests
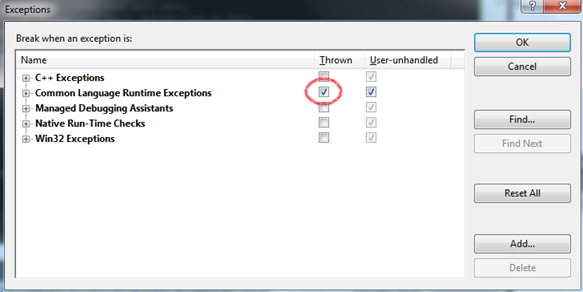
If you still haven’t got to the bottom of your test Error, then you can always debug the tests. Before you start debugging, make sure that you’re catching all exceptions from the Debug/Exceptions menu (or Ctrl-Alt-E):
Hopefully these tips will help you identify the cause of your unit test errors - good luck!


